Analyzing Personal Finances with Python and Ledger
As a sign of my über-nerddom, I use plain text accounting tool ledger to track my personal finances. Recently, my friend convinced me to take a course on machine learning with Python from Udemy. I’m taking that course now. So far, I’ve learned up through most of the unit on Pandas, which is a Python library that’s kind of like Excel for Python. Itching to use what I’ve learned on real-world data, my personal financial data was a clear choice. This post aims to take you through my experience of trying to use Pandas to explore financial data from ledger.
Tools used for the job (and a detour)
I’ll be using a Jupyter notebook in VS code for this job.
Aside from that, I’ll be using ledger, xq (a CLI XML processing tool that uses jq under the hood), and the Pandas library from Python. I’m using the latest version of Python as of this writing, 3.12.4.
If you want to do this on an Arch Linux distro, you should probably be able to get started with the following command, although I used pip and installed an environment with venv, instead:
$ pacman -S jupyter-notebook python-pandas ledger yq
Getting data into Python
To start, I needed to get the data into Python. This proved more difficult than I thought it would be. Ledger has two commands I thought to try, ledger csv and ledger xml. The CSV output turned out to be impossible to handle, so I decided to go with the XML output instead. I put this cell at the top of my notebook:
!ledger -f 2024.journal xml ^Expenses > 2024-expenses.json

import pandas as pd
import numpy as np

with open ("2024-expenses.json", "r") as f:
    df = pd.read_json(f)
… And this didn’t work. I got an empty DataFrame. I had to take a look at the structure of the XML output. I used the trusty tool jq keys 2024-expenses.json, which told me this:
[
  "ledger"
]
Ah. There’s a root object. Looking inside with jq '.ledger|keys':
[
  "@version",
  "accounts",
  "commodities",
  "transactions"
]
Now I can start to see how I’ll get the data into Pandas. After experimenting, I confirmed that I want what’s in the “transactions” object. So, the final cell looked like this:
!ledger -f 2024.journal xml ^Expenses | xq '.ledger.transactions[]' > 2024-expenses.json

import pandas as pd
# ...
Cleaning up the data
There, so the data’s all imported into Pandas. We’re ready to rock and roll, right? Nope. The key part of the data—the postings, the actual money moving in and out of accounts—is buried somewhere in the mammoth “postings” column of the DataFrame. It’s time to go spelunking. Sigh…
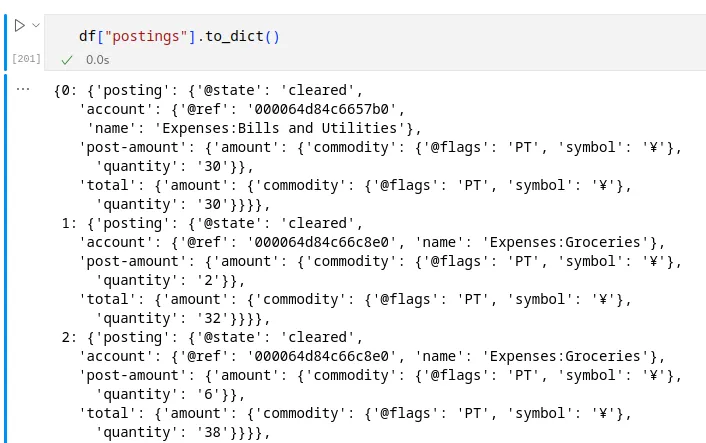
Here’s what the “postings” column looks like. It’s horrible.

A screenshot of VS Code showing how horrible the imported data looks
I would have loved to just have three columns, “account,” “commodity,” and “amount.” But my commodity’s buried five levels deep into that structure. Similarly, the amount is four levels deep, and the account name is two levels deep. Through trial and error, here’s how I pulled those data from the depths of obscurity to the light and day of their own columns:
# Break down the "postings" field into useful columns
postings = pd.DataFrame.from_dict(
    [
        {
            "account": row["posting"]["account"]["name"],
            "currency": row["posting"]["post-amount"]["amount"]["commodity"]["symbol"],
            "amount": row["posting"]["post-amount"]["amount"]["quantity"],
        }
        for row in df["postings"]
    ]
)
There’s a lot going on there, but the big picture is I’m creating a new DataFrame from a dictionary. I used a list comprehension to make a new Python list from the “postings” column of my original DataFrame. Each item in the list is a dictionary with the three columns I want as keys. The list comprehension works by looking at each row in df["postings"] and drilling down as necessary to access the required data. (Note: I’m no professional programmer—is my code easy to read? It’s good enough for me, at least.)
# Get rid of the original "postings" column
df = df.drop(["postings"], axis=1)
# Stick the two DataFrames together. axis=1 tells
# pd to glue by column instead of by row
df = pd.concat([df, postings], axis=1)

# Finally, sort by date
df = df.sort_values(by="date")
After that, we’re a lot closer to being able to do something useful with the data. Nice!
Break time
This was a lot of work. It took me about two hours to write this up, but many more to get to this point. It’s time for a break! In my next write-up on this topic, I’ll try to find some useful ways to look at all the data. I’m excited for my hard work to pay off!